Anytime you see a down arrow, it indicates a drop-down menu. Here’s a high level overview of each menu:
| Name | Definition |
|---|---|
| Dashboard | Includes an overview of data received, data tickets generated, min/max limit alerts, and a summary of data reported for the current day. |
| BOL Recon | |
| Configuration | This tab allows you to view files and verifying the expected time for a document for a specific group. If no tickets are being generated, you can view the files to determine if the group is active, but not being monitored. Menus include:
|
| Support Tickets | The Support Tickets tab allows you to access tickets from the last 30 days. There are two types of tickets you can access:
|
| Management | This tab allows you to view rules allocated to different terminals or pipelines to determine the reasons validation failures occurred. There are two types of rules:
|
| Reports | Document Viewer allows you to view your XML documents before (input) and after (output) they were sent through DTN TIMS. |
| Settings | Here are the following items you can complete in the Settings tab:
|
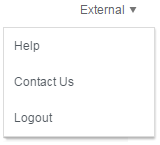
If you click on your user name, you see Help, Contact Us, and Logout:
